Updated: Docker Monitoring Prometheus + Grafana

It's been almost a year since I started the initial Docker Monitoring project. Shortly after the project spun into a Docker Prometheus stack when I discovered the cAdvisor integration.
A year is a long time in Open-Source Software projects. I like to think that Open Source projects are measured in dog years, as one year seems like much longer when looking back on all the versions.
Reflecting back on my first commitment to the project, a lot has changed and improved with Prometheus, cAdvisor, and Grafana. All of them have added new features and integrations and look better.
Updating the Prometheus stack has been on my to-do list for quite some time. I've updated the project a couple of times just to keep it working with the latest docker-compose versions and then migrated to compose version 2 format.
And then... I was lucky enough to receive a Pull Request from Philicious last week, which kicked off the project update and forced me to complete it. He did an amazing job refactoring the project.
What's New
The new stack comprises Prometheus, Grafana, cAdvisor and Node_Exporter
- Moved away from the Prometheus PromDash Dashboard and instead integrated the far better Grafana
- Added an environment file to set Usernames and Passwords for Grafana. It can also be adapted for further variables for Grafana.
- We no longer build images locally and pull everything from Docker Hub
- Added Node_Exporter to gather machine(host) metrics
- Created internal and external network connections between containers.
Grafana
Switching to Grafana was a logical move. Grafana has advanced considerably in the last year, and graphing has become much easier, and the integration with Prometheus is seamless.
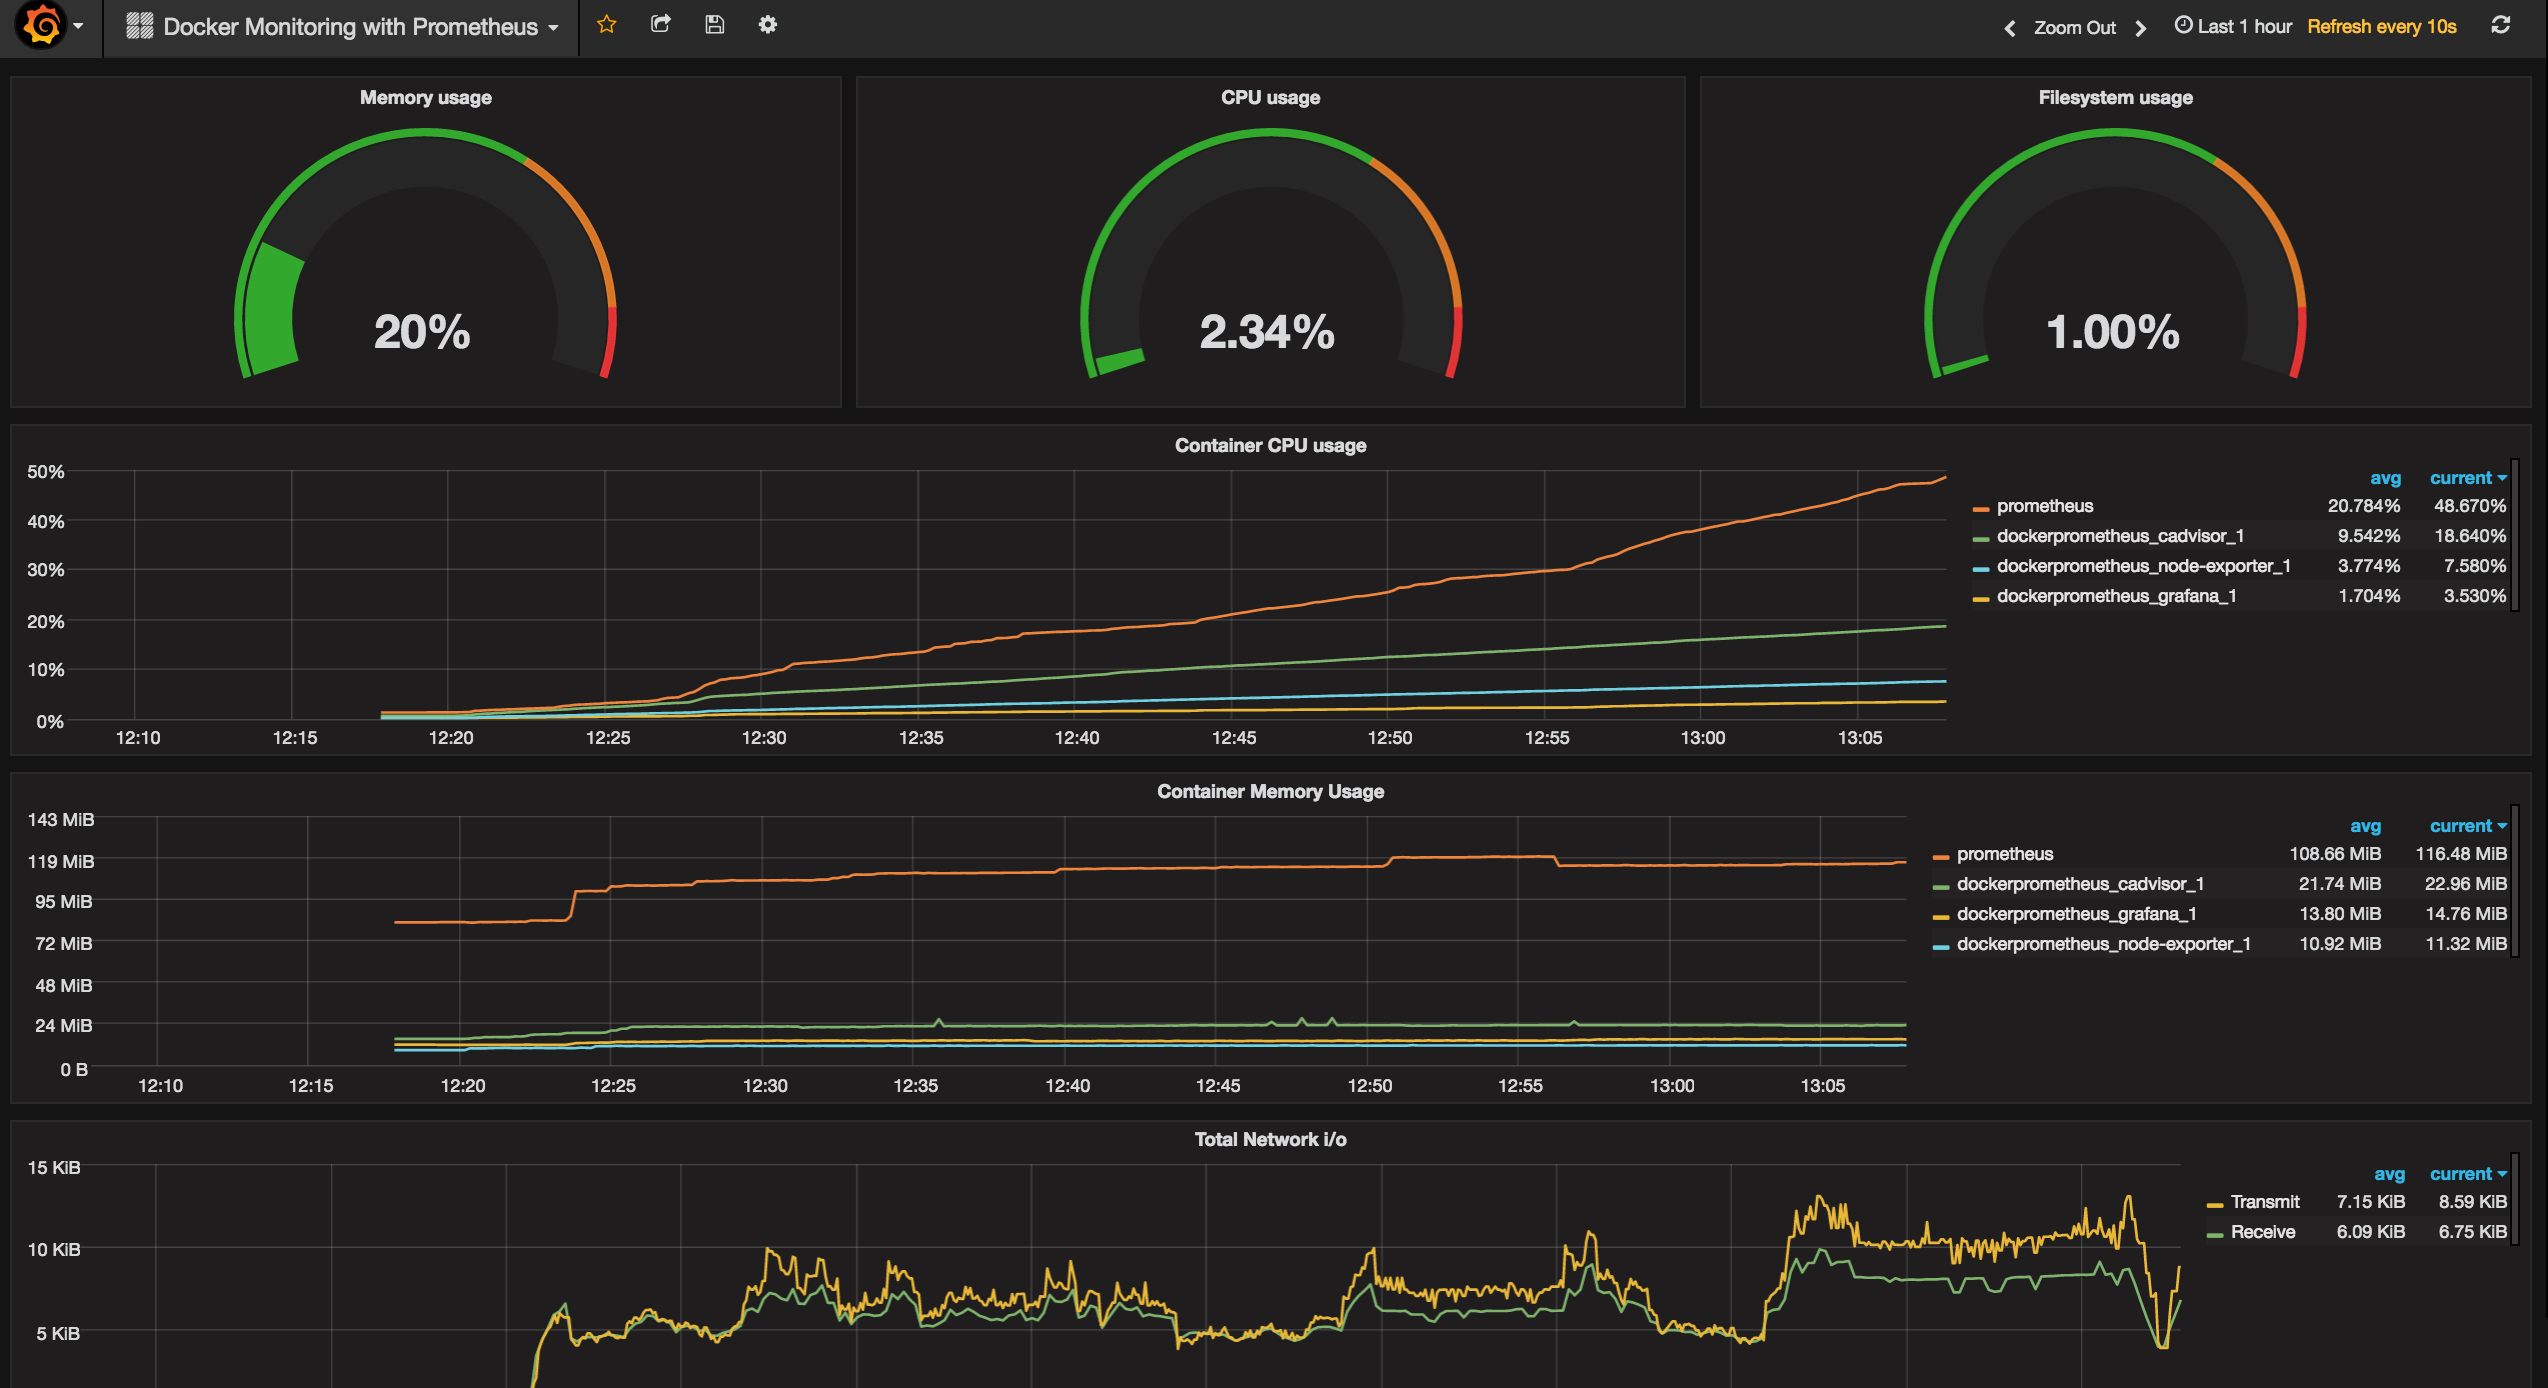
@Philicious and I both created Dashboards for the project. I forked my Dashboard from the Grafana Kubernetes project and adjusted the queries to match up with cAdvisor. Docker Dashboard
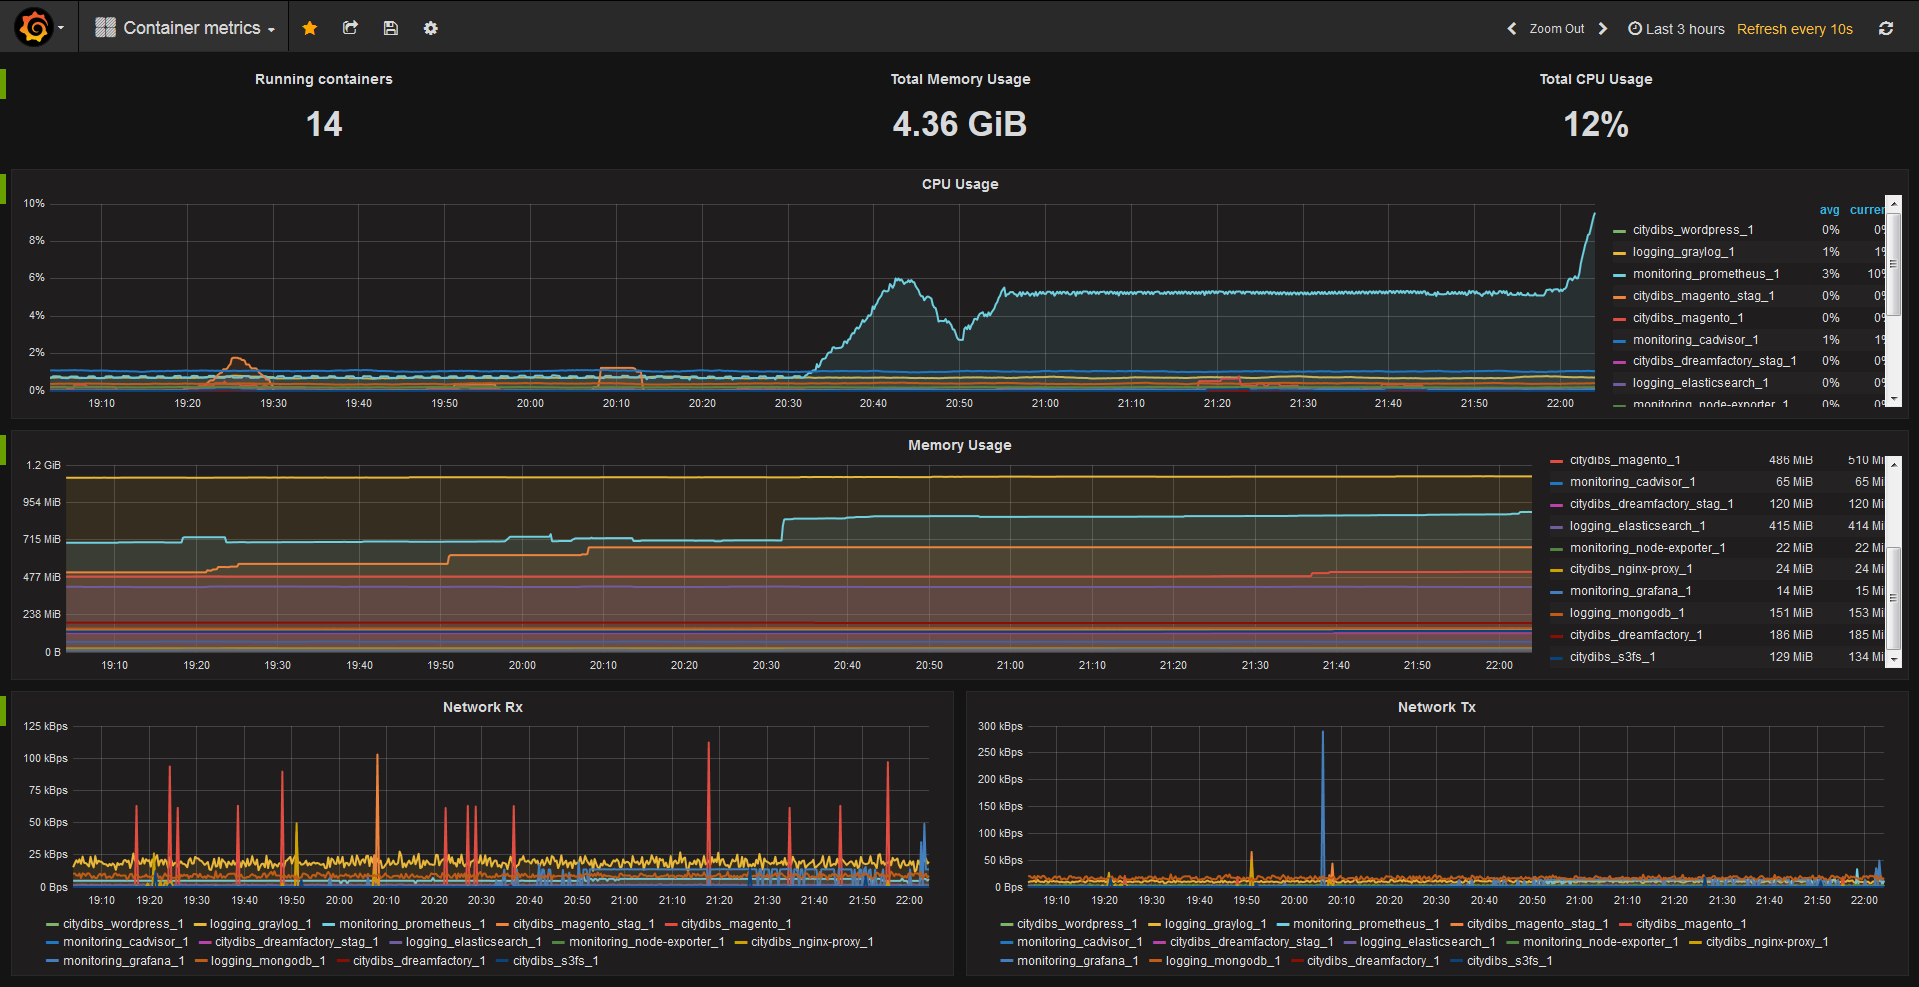
@Philicious created a great dashboard for the project, which provides a lot of great metrics and graphs https://grafana.net/dashboards/193
Please try both dashboards and provide suggestions or both dashboards are also available on Github.
Get Started
To get started, all that is required is a Docker Host or Docker for Mac/Windows with the latest version of Docker installed along with Docker-Compose.
Head over to https://github.com/vegasbrianc/prometheus and get started monitoring. Please provide any suggestions or open issues if you spot anything out of place.
Follow me
If you liked this article, Follow Me on Twitter to stay updated!