How to Track Docker Hub Metrics
Learn how to track Docker Hub metrics with this guide. Discover tools and methods for monitoring image performance, automating metric tracking, and analyzing data to optimize your Docker Hub presence.
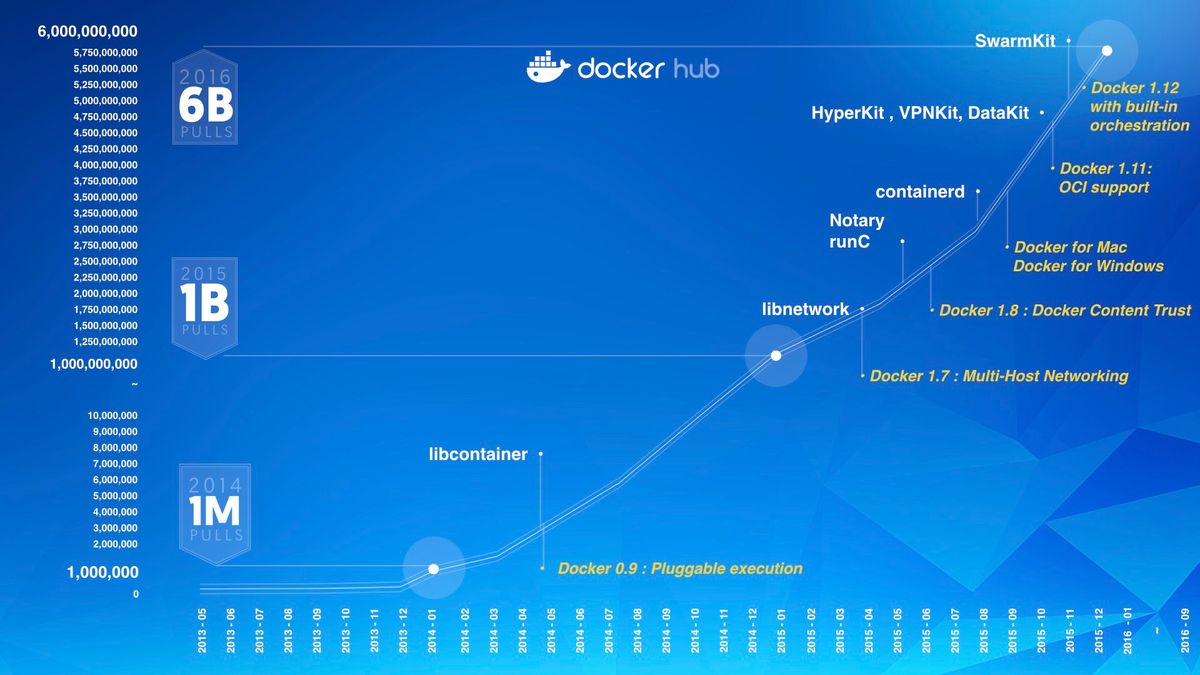
I'm quite fascinated with the growth we have witnessed with Docker. We have seen in 3 years Docker achieve over 6 Billion Pulls (Yes, Billion with a B) in September.
Amazing! A pull is essentially a download of a Docker image (Ubuntu, Redis, nginx, etc) from Docker Hub.
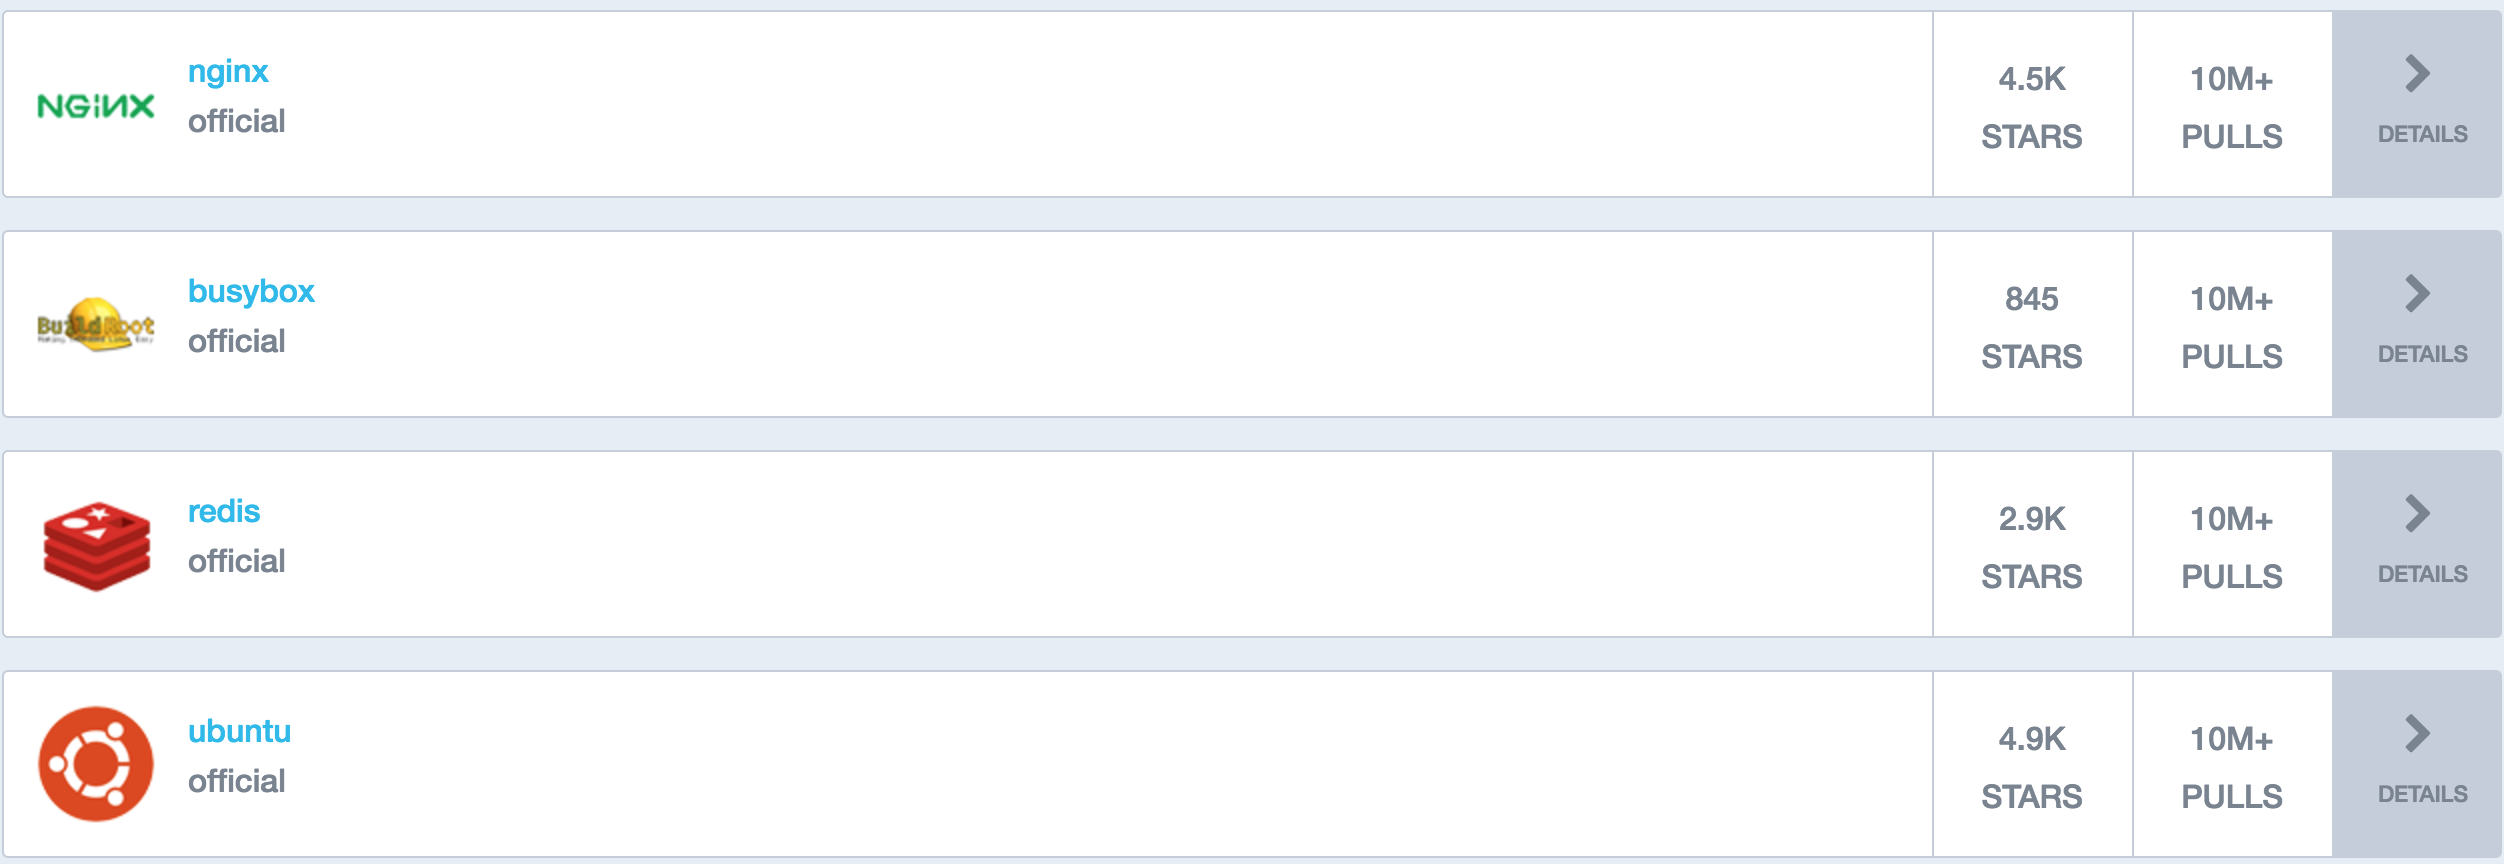
My curiosity started when I started exploring various images on Docker Hub for a project. I clicked on Explore within Docker Hub, and this is where my curiosity jumped up and grabbed hold of me.
Within the Docker Hub Explore tab is where all the Official images are located. Most of these images state they have 10+ Million Pulls. This ladies and gentleman is when I started asking myself "
How many pulls does 10M+ really mean?" The journey begins.
Since I'm a monitoring nerd, I thought this might be a perfect opportunity to repurpose my Prometheus Monitoring project to track Docker Pulls.
The hunt was to find a container that uses the Docker Hub API to gather metrics from certain reports. I stumbled upon the Prometheus Docker Hub exporter by Infinity Works. This container exposes metrics of image pulls and stars on selected images within Docker Hub. Brilliant!
Configuring Prometheus to Track Docker Pulls
Now that we have found an exporter, we need to integrate it into our Prometheus stack. I've created a new docker-compose file that adds the Docker-Hub-Exporter service and connects it to Prometheus. The Docker-Hub-Exporter uses environment variables to determine which images to track on Docker Hub. Change this to the images you are interested in tracking.
metrics:
     image: infinityworks/docker-hub-exporter
     ports:
       - 9170:9170
     environment:
       - "IMAGES=google/cadvisor, library/alpine, library/ubuntu"
     networks:
       - back-tier
Now that our Docker-Hub-Exporter is integrated into our Prometheus stack, we now need to inform Prometheus what to do with the metrics from the new Docker-Hub-Exporter. This is performed by updating the prometheus.yml file's static_configs.
This configuration tells Prometheus to retrieve the metrics produced by Docker-Hub-Exporter. For our new target, the hostname is metrics, and the port is 9170.
 static_configs:
         - targets: ['node-exporter:9100','localhost:9090', 'metrics:9170']
Start your stack, and you should now be retrieving Docker Hub metrics from the images you selected for your Prometheus stack.
Graphing Docker Pulls
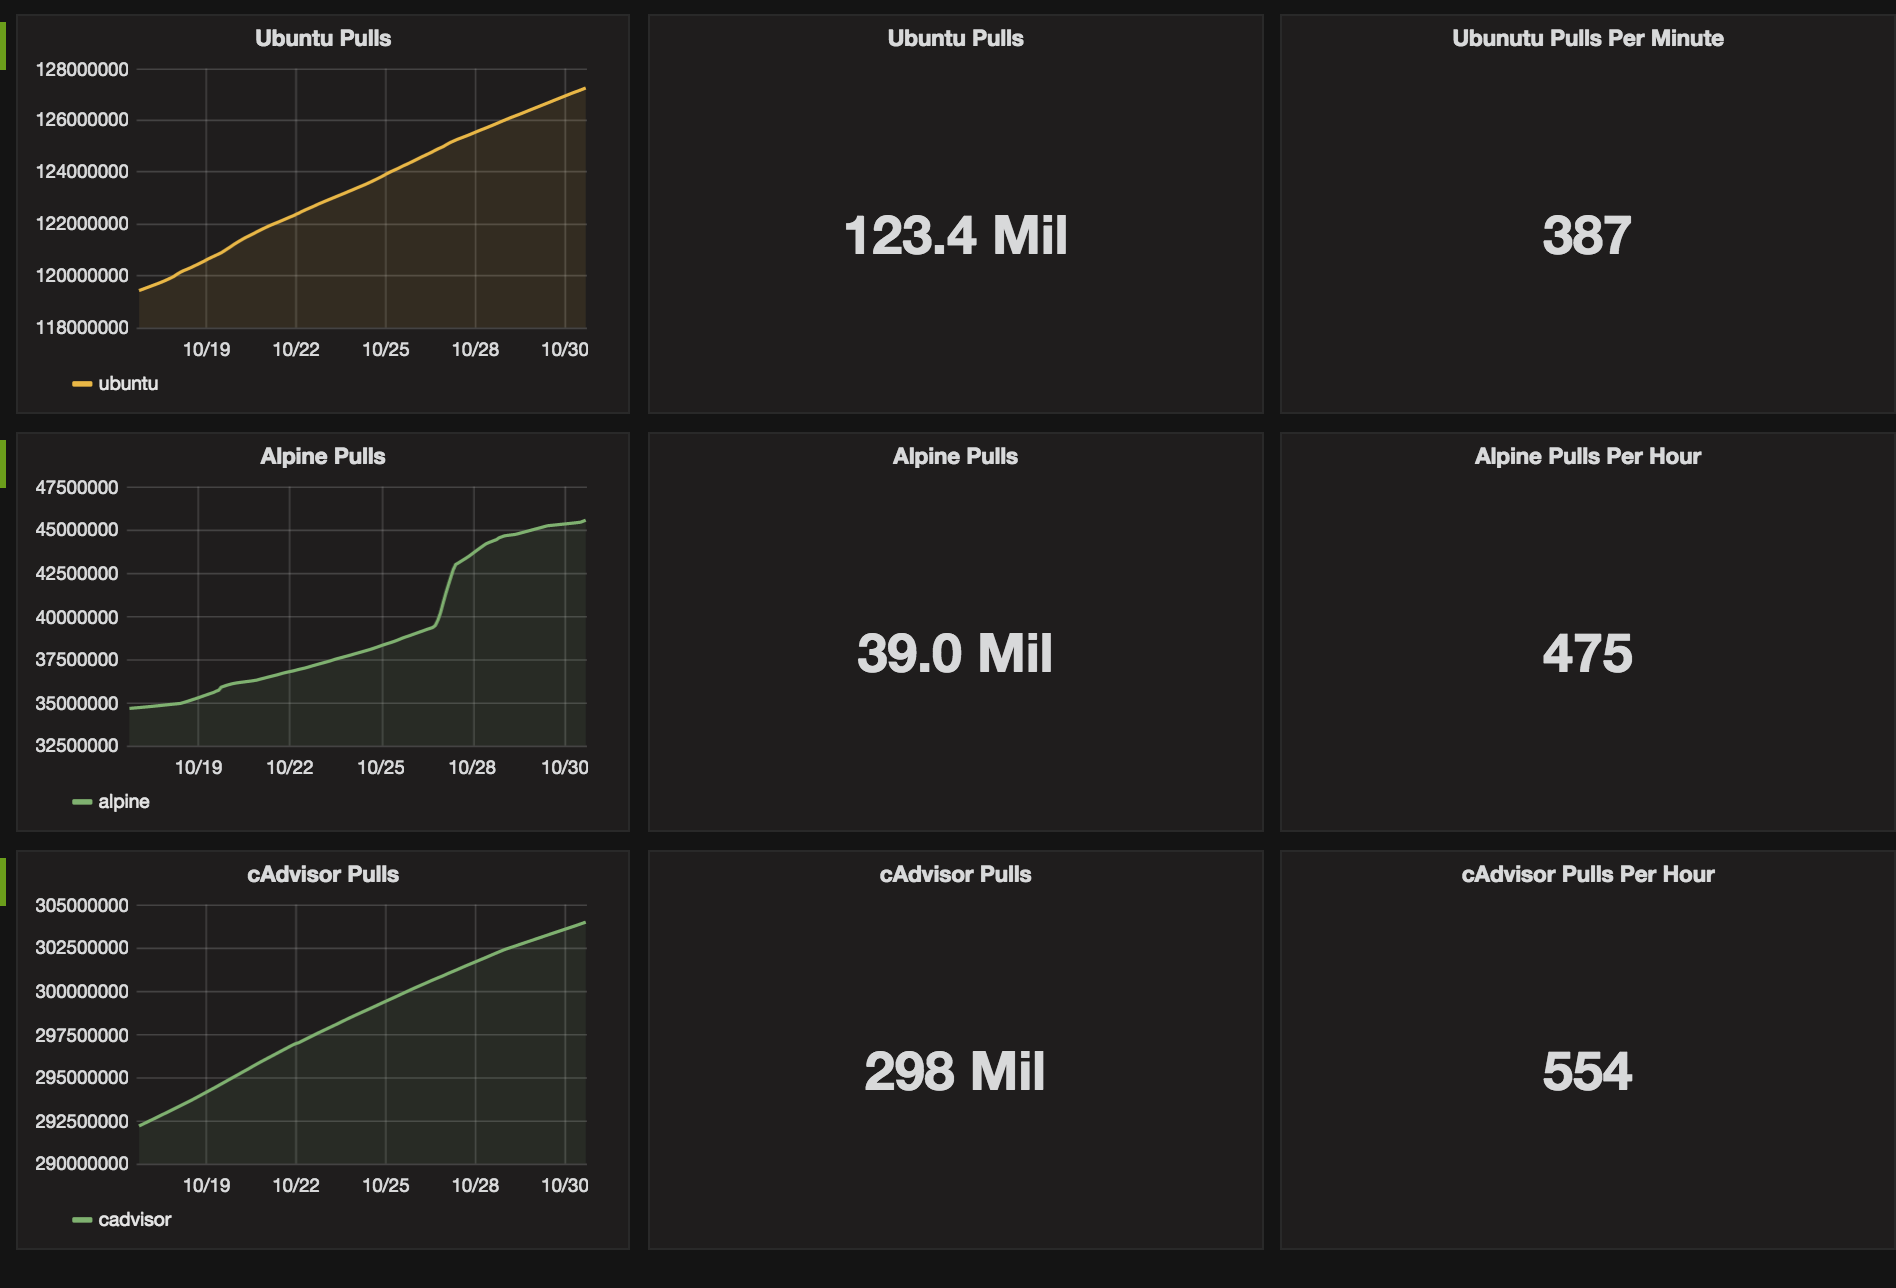
This is where it starts getting interesting. We need to start visualizing the data we are retrieving from our monitoring stack.
I created a baseline Grafana Dashboard that tracks three different images from Docker Hub; Alpine, cAdvisor, and Ubuntu, which I declared in the prometheus.yml. This is a good starting point for tracking your images. I didn't include Repository Stars as it was irrelevant for my testing.
Conclusion
I started this project out of interest to see how quickly images were being pulled and to understand the integration of 3rd party Prometheus Exporters. I learned a lot, and hopefully, you can use it to watch your Docker image pulls skyrocket.
The information I gathered during this experiment shocked me so much that I will write a follow-up blog to explain it further.
FAQ Section: How to Track Docker Hub Metrics
What are Docker Hub metrics, and why should I track them?
Docker Hub metrics provide insights into the usage and performance of your Docker images, including the number of pulls, stars, and automated build statuses. Tracking these metrics is important because it helps you understand the popularity of your images, identify trends in usage, and ensure that your images are functioning correctly and meeting user needs.
How can I track Docker Hub metrics?
You can track Docker Hub metrics by using tools like Docker Hub’s built-in analytics, third-party monitoring tools, or custom scripts that access Docker Hub’s API. These methods allow you to gather data on image pulls, stars, and other important metrics, which you can then analyze to understand your image’s performance and popularity over time.
What tools are available for monitoring Docker Hub metrics?
Several tools are available for monitoring Docker Hub metrics, including Docker Hub’s native analytics dashboard, third-party services like Datadog and Prometheus, and custom scripts that leverage the Docker Hub API. These tools provide different levels of detail and customization, allowing you to choose the best fit for your needs.
Can I automate the tracking of Docker Hub metrics?
Yes, you can automate the tracking of Docker Hub metrics by setting up automated scripts or using monitoring tools that regularly poll the Docker Hub API for metrics data. This automation can help you maintain a continuous understanding of your image's performance without requiring manual checks, enabling timely responses to any issues or changes in usage patterns.
What can I learn from analyzing Docker Hub metrics?
Analyzing Docker Hub metrics can provide valuable insights into the popularity of your Docker images, user engagement, and the effectiveness of updates or changes. By tracking trends in image pulls, stars, and build success rates, you can identify which images are most successful, detect potential issues early, and make data-driven decisions to improve your Docker offerings.
Follow me
If you liked this article, Follow Me on Twitter to stay updated!